The Vanishing Bid: How Order Book Illusions Trap Retail Traders at the Worst Possible Moment

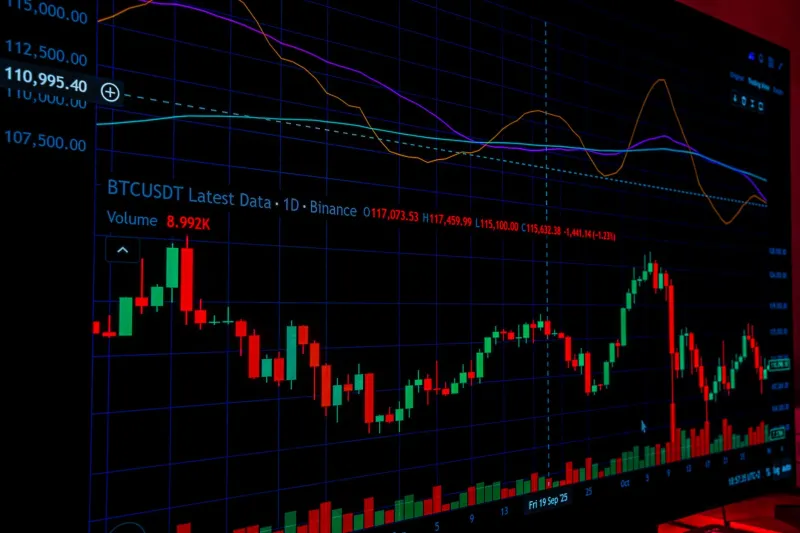
Photo: stock market order book trading screen depth chart, via thumbs.dreamstime.com
There is a particular frustration that experienced traders recognize immediately: the moment you commit to an exit, the market that looked perfectly liquid thirty seconds ago develops a sudden and inexplicable thinness. Your order sits. The spread widens. The fill comes back worse than any reasonable reading of the tape would have suggested. This is not bad luck. It is a structural feature of modern market microstructure, and understanding it is one of the most practically valuable things an active trader can do.
What Volume Numbers Actually Measure — And What They Don't
Volume, as displayed on most retail trading platforms, is a historical figure. It tells you how many shares changed hands in a given period. What it does not tell you is how many shares are genuinely available to trade at the current moment, at the current price, without moving that price against you.
The distinction matters enormously. A stock that has traded 4 million shares today may have a live order book that is paper-thin at the inside bid and ask. The historical volume reflects what was possible; the current order book reflects what is available right now. These two numbers can diverge dramatically, and they tend to diverge most dramatically at precisely the moments when retail traders are most motivated to act.
This is not coincidental.
Spoofing, Layering, and the Architecture of Artificial Depth
Regulatory action over the past decade has made outright spoofing — placing large orders with no intention of filling them — a legally risky practice. Yet the underlying dynamic that spoofing exploited has not disappeared. It has simply become more nuanced.
Market makers and sophisticated algorithmic participants routinely post limit orders that represent genuine commitments only within narrow conditions. When order flow begins to shift in a particular direction, these participants can reduce their exposure, widen their quotes, or pull posted size faster than any retail platform can refresh. The result is that the depth you see on a Level II screen at 9:58 a.m. may bear little resemblance to the depth that exists at 9:59 a.m. when you finally pull the trigger.
This phenomenon is most pronounced in three specific environments: around psychologically significant price levels (round numbers, 52-week highs and lows, prior session closes), during the minutes immediately preceding and following major data releases, and in individual equities during the two to three days surrounding earnings announcements. In each case, the traders with the fastest infrastructure and the best information about order flow are actively managing their exposure — which means the liquidity that appeared to support your position may have already been repositioned before your exit order reaches the exchange.
Key Price Levels as Liquidity Traps
One of the more counterintuitive realities of market microstructure is that the price levels that attract the most visual attention from retail traders are also the levels where liquidity is most likely to be engineered rather than organic.
Consider a stock approaching a clean round number — say, a widely held name approaching $100 for the first time in eighteen months. Retail interest is high. Options activity is elevated. The stock appears to have deep bids just below the level and strong offers just above it. What this picture often conceals is that the apparent depth around that level is populated partly by participants who are hedging existing positions rather than providing genuine two-sided liquidity, and partly by algorithmic systems that will withdraw their quotes the moment directional pressure becomes too pronounced.
The result: a trader attempting to exit a long position just below that $100 level, expecting to find the bids that were visible on the tape an hour earlier, may discover that those bids have thinned to a fraction of their apparent size. The exit that looked clean on a theoretical basis becomes a slippage event in practice.
Sizing for Reality, Not for Advertised Volume
The most actionable response to this structural reality is to recalibrate position sizing against realistic rather than advertised liquidity. A common rule of thumb among professional traders is to avoid sizing any single position such that the intended exit would represent more than 5 to 10 percent of the average volume traded in the worst liquidity window of the trading day — typically the final thirty minutes before the close, or the first fifteen minutes after the open.
This is a more conservative standard than most retail traders apply. It is also a more honest one. If a stock averages 500,000 shares per day but trades only 30,000 shares in the final half hour, the relevant liquidity figure for a trader who expects to exit near the close is 30,000 — not 500,000.
For options traders, the liquidity problem is amplified. Open interest figures and daily volume statistics in options chains routinely overstate the practical liquidity available in any given contract at any given moment. Wide bid-ask spreads are the visible symptom; the less visible symptom is that even the mid-market quote may not be fillable when you need it.
Structuring Exits Before You Enter
Perhaps the single most effective adaptation to the liquidity mirage problem is to plan exits with the same analytical rigor applied to entries — and to plan them before the position is opened, not after.
This means identifying, in advance, the specific price levels at which you intend to exit, the order types you will use (limit orders rather than market orders in thin conditions), and the acceptable slippage tolerance that will trigger a reassessment of the position size itself. It also means building in contingency for the scenario where your primary exit becomes unavailable — whether because liquidity has evaporated, because a halt has occurred, or because the spread has widened beyond your tolerance.
Traders who treat exit planning as an afterthought tend to discover its importance at the most expensive possible moment. The volume spike on your chart right before your order gets rejected is not an anomaly. It is the market telling you exactly what it thinks of unprepared participants.
The Practical Edge
None of this is an argument against active trading. It is an argument for trading with an accurate model of how markets actually function rather than how they appear to function on a standard retail platform. The traders who consistently manage slippage, preserve capital during thin conditions, and exit positions at prices close to their intended levels are not necessarily smarter than their peers. They are simply more honest about the difference between displayed liquidity and available liquidity — and they have built their strategies around that distinction rather than in spite of it.