Reading the Volatility Surface: How Options Positioning Before Earnings Telegraphs the Stocks Most Likely to Detonate
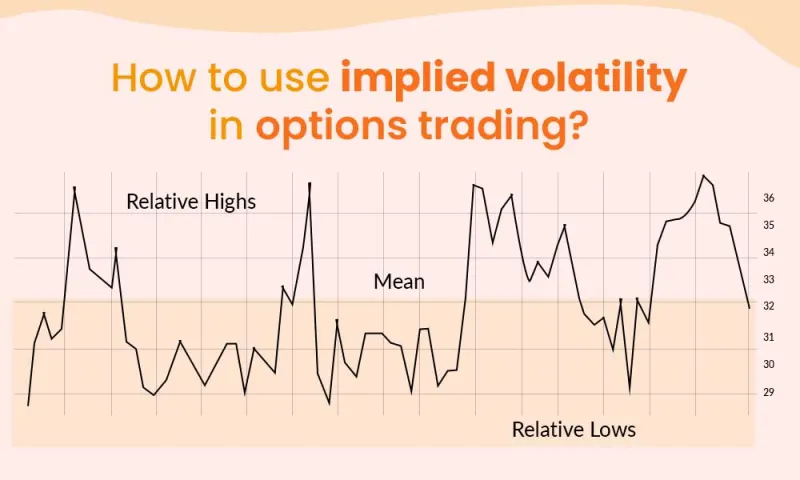
Photo: options trading volatility chart earnings financial data analysis, via www.truedata.in
Earnings season has a way of humbling traders who approach it with straightforward directional bets. A company beats estimates by a wide margin and the stock drops four percent. A company misses and rallies. The apparent randomness of these outcomes frustrates retail participants and reinforces the perception that earnings trades are little more than structured gambling. Professional options traders see the same events differently — because they are reading a different set of inputs.
The options market, in the days leading up to an earnings announcement, functions as a distributed forecasting mechanism. Thousands of participants with varying degrees of information and analytical sophistication are simultaneously expressing views through the pricing of calls, puts, and volatility contracts. When you know how to interpret what that collective positioning is saying, the earnings calendar transforms from a randomness generator into a structured opportunity set.
The Expected Move and Its Discontents
The starting point for any serious earnings-oriented options analysis is the expected move — the magnitude of price change that the options market is implying for the stock following its announcement. This figure is typically derived from the at-the-money straddle price in the nearest expiration that captures the earnings date, and it represents the market's consensus estimate of how much the stock will move, in either direction, after results are released.
The expected move is useful. It is not, however, the end of the analysis. What matters more than the expected move itself is the relationship between the expected move and the stock's historical earnings reactions, and the distribution of implied volatility across strikes and expirations — the volatility surface.
When the implied expected move is significantly larger than the stock's average historical earnings reaction, the options market is either pricing in unusual uncertainty or responding to information that suggests this particular quarter carries above-average surprise potential. When the expected move is significantly smaller than historical norms, the market may be underestimating the potential for an outsized reaction — a miscalibration that can be exploited.
Skew as an Intelligence Signal
Volatility skew — the difference in implied volatility between out-of-the-money puts and out-of-the-money calls at the same distance from the current price — is one of the most information-dense signals available in pre-earnings options analysis.
In most equity names, puts carry higher implied volatility than equivalent calls. This reflects the persistent demand for downside protection and the asymmetric nature of equity risk. What is analytically interesting is when skew deviates from its own historical baseline in the days before an earnings report.
A stock that normally carries a moderate put skew but develops an unusually steep skew in the week before earnings is signaling something. It may reflect institutional hedging of existing long positions. It may reflect informed positioning by participants who have developed a specific thesis about downside risk. It may reflect the options market's collective judgment that the downside scenario for this particular name is more severe than the upside scenario is rewarding.
Conversely, a stock where call skew becomes elevated — where out-of-the-money calls are pricing at a premium relative to equivalent puts — is signaling asymmetric upside expectation. This pattern, while less common, is particularly interesting in names where short interest is elevated, as the combination can foreshadow aggressive short-covering rallies.
Put-Call Ratios: Reading Positioning, Not Just Sentiment
Put-call ratios are frequently cited as sentiment indicators, with high ratios interpreted as bearish and low ratios as bullish. This interpretation is incomplete and, in the context of earnings analysis, often misleading.
A more useful framework distinguishes between put-call ratios that reflect protective hedging and those that reflect directional speculation. Institutional investors routinely purchase puts against existing long positions as a cost of doing business around earnings — this activity will show up in a high put-call ratio without reflecting genuine bearish conviction. The question is whether the put volume is concentrated in strikes that represent realistic downside targets (suggesting directional bets) or spread across a range of strikes at relatively low delta (suggesting hedging activity).
When significant put volume is concentrated in specific out-of-the-money strikes in the week before earnings, particularly in names where such concentration is historically unusual, the signal is worth taking seriously. The same logic applies to unusual call concentration in names where the options market is not typically positioned for upside surprise.
Term Structure and the Earnings Volatility Premium
The term structure of implied volatility — how implied volatility varies across different expiration dates — provides another layer of signal before earnings. In a normal environment, longer-dated options carry higher implied volatility than shorter-dated options, reflecting the greater uncertainty associated with a longer time horizon.
In the period before earnings, this relationship typically inverts for the expirations that bracket the announcement date. The near-term implied volatility spikes as the market prices in earnings uncertainty, while longer-dated volatility remains relatively stable. The degree of this inversion — how steeply the near-term implied volatility has been bid up relative to longer-dated contracts — provides a read on how much premium the market is charging for earnings exposure.
When near-term implied volatility has been elevated for an unusually long period before the announcement, or when it has risen more steeply than comparable names in the same sector, the market is expressing heightened uncertainty about this specific event. That elevated premium can itself become the trade: selling the near-term volatility after it has been bid to an extreme, using structures that define risk, is a legitimate strategy when the expected move appears to be substantially overpriced relative to what the company is likely to actually deliver.
Building a Framework, Not a Formula
The most important caveat in earnings-oriented volatility analysis is that no single signal is reliable in isolation. Steep skew, unusual put concentration, and an inflated expected move together constitute a meaningful thesis. Any one of them alone is noise.
The traders who use these tools most effectively approach pre-earnings options analysis as an intelligence-gathering exercise rather than a mechanical trading system. The goal is to develop a probabilistic view of whether the market is correctly calibrated for the upcoming event — and to identify the specific structures (long straddles, ratio spreads, calendar trades, or directional positions sized against the volatility premium) that offer the most favorable risk-adjusted exposure to that view.
Earnings are never truly predictable. But the options market's assessment of earnings risk, and the degree to which that assessment is distorted by positioning, hedging flows, and sentiment extremes, is far more legible than most retail participants realize.